High-Frequency Trading: Latency and Execution
High-frequency trading operates at timescales where the speed of light becomes a binding constraint. Understanding the HFT landscape is not just relevant for HFT practitioners — it is essential for any algorithmic trader who wants to understand the execution environment they operate in.
The Latency Stack
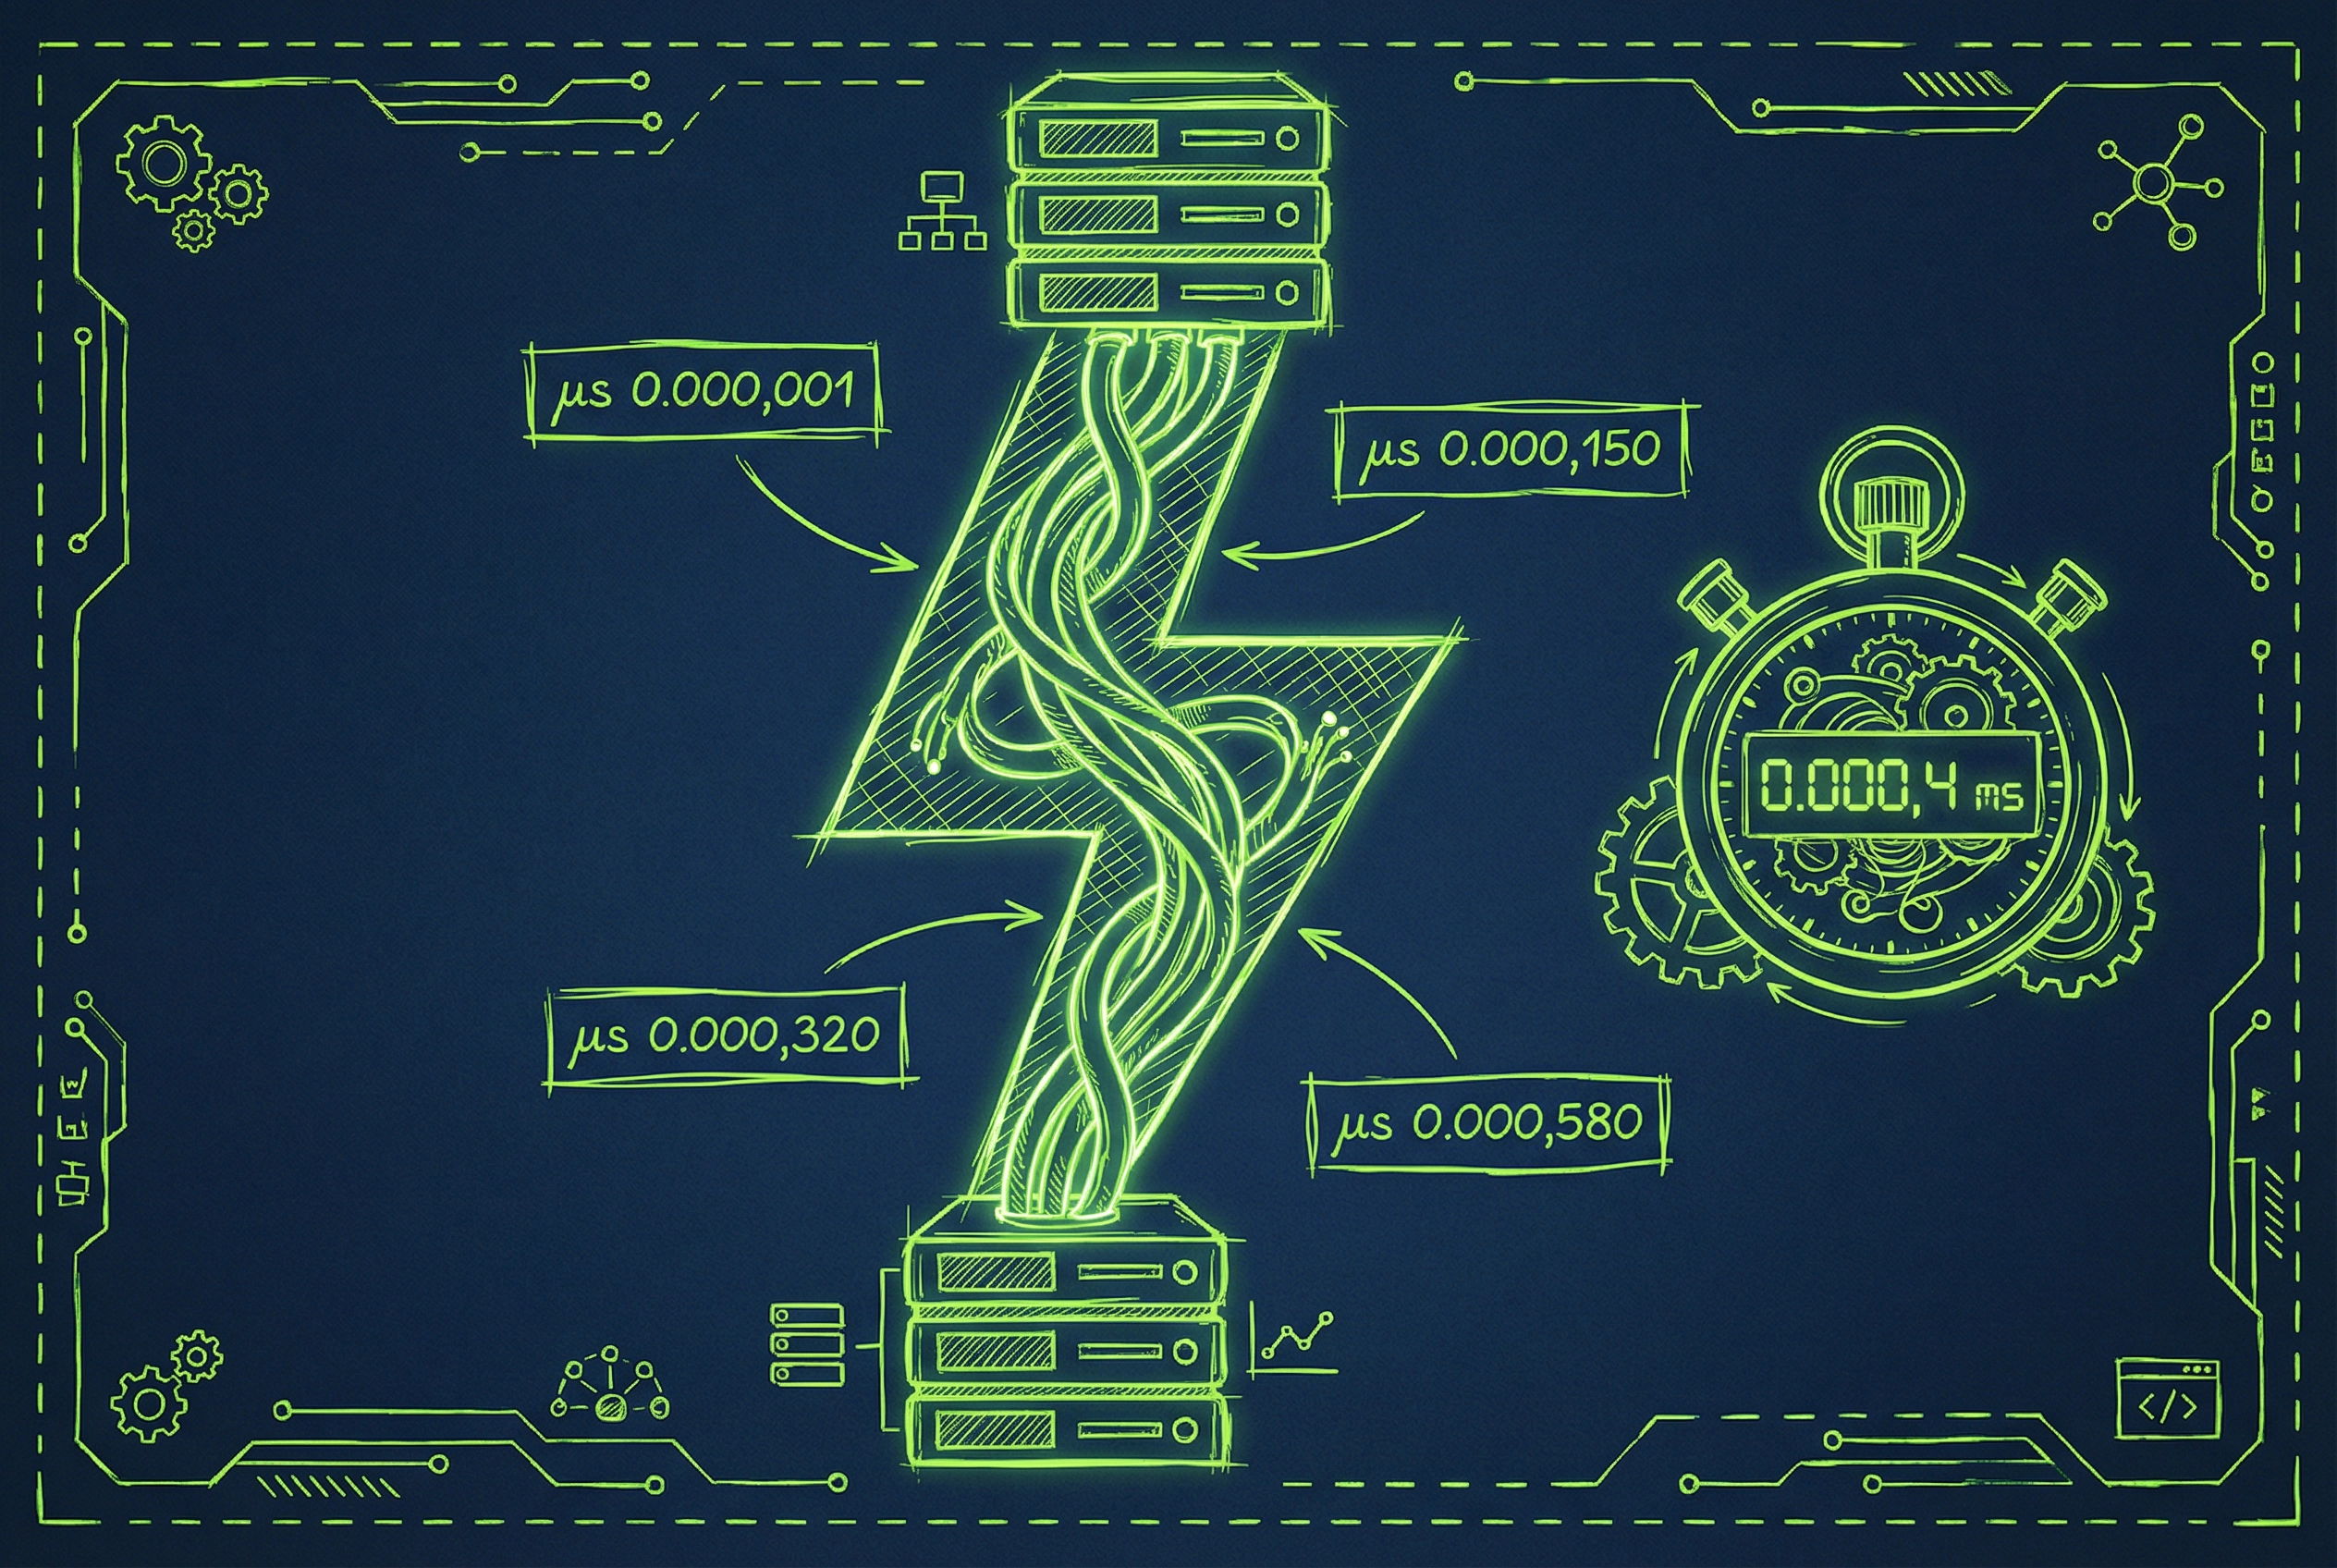
Every order you send to an exchange passes through a latency stack:
- 1.Strategy computation: 1–100 microseconds (depends on hardware and algorithm complexity)
- 2.Network transmission: 1–50 microseconds (co-location) to 1–50 milliseconds (remote)
- 3.Exchange matching engine: 1–10 microseconds
- 4.Confirmation receipt: same as transmission, reversed
The total round-trip time for a co-located HFT firm is typically 10–100 microseconds. For a retail trader on a standard internet connection, it's 1–50 milliseconds — 100–1000x slower.
Co-location and Market Access
Co-location means placing your trading servers physically inside the exchange's data center. This minimizes network latency to the exchange matching engine. Major exchanges (NYSE, NASDAQ, CME) offer co-location services for a fee.
For non-HFT algorithmic traders, co-location is rarely necessary. The edge in most systematic strategies operates on timescales of minutes to days, where a few milliseconds of latency is irrelevant.
Execution Quality Metrics
Even if you're not competing on latency, execution quality matters. Key metrics:
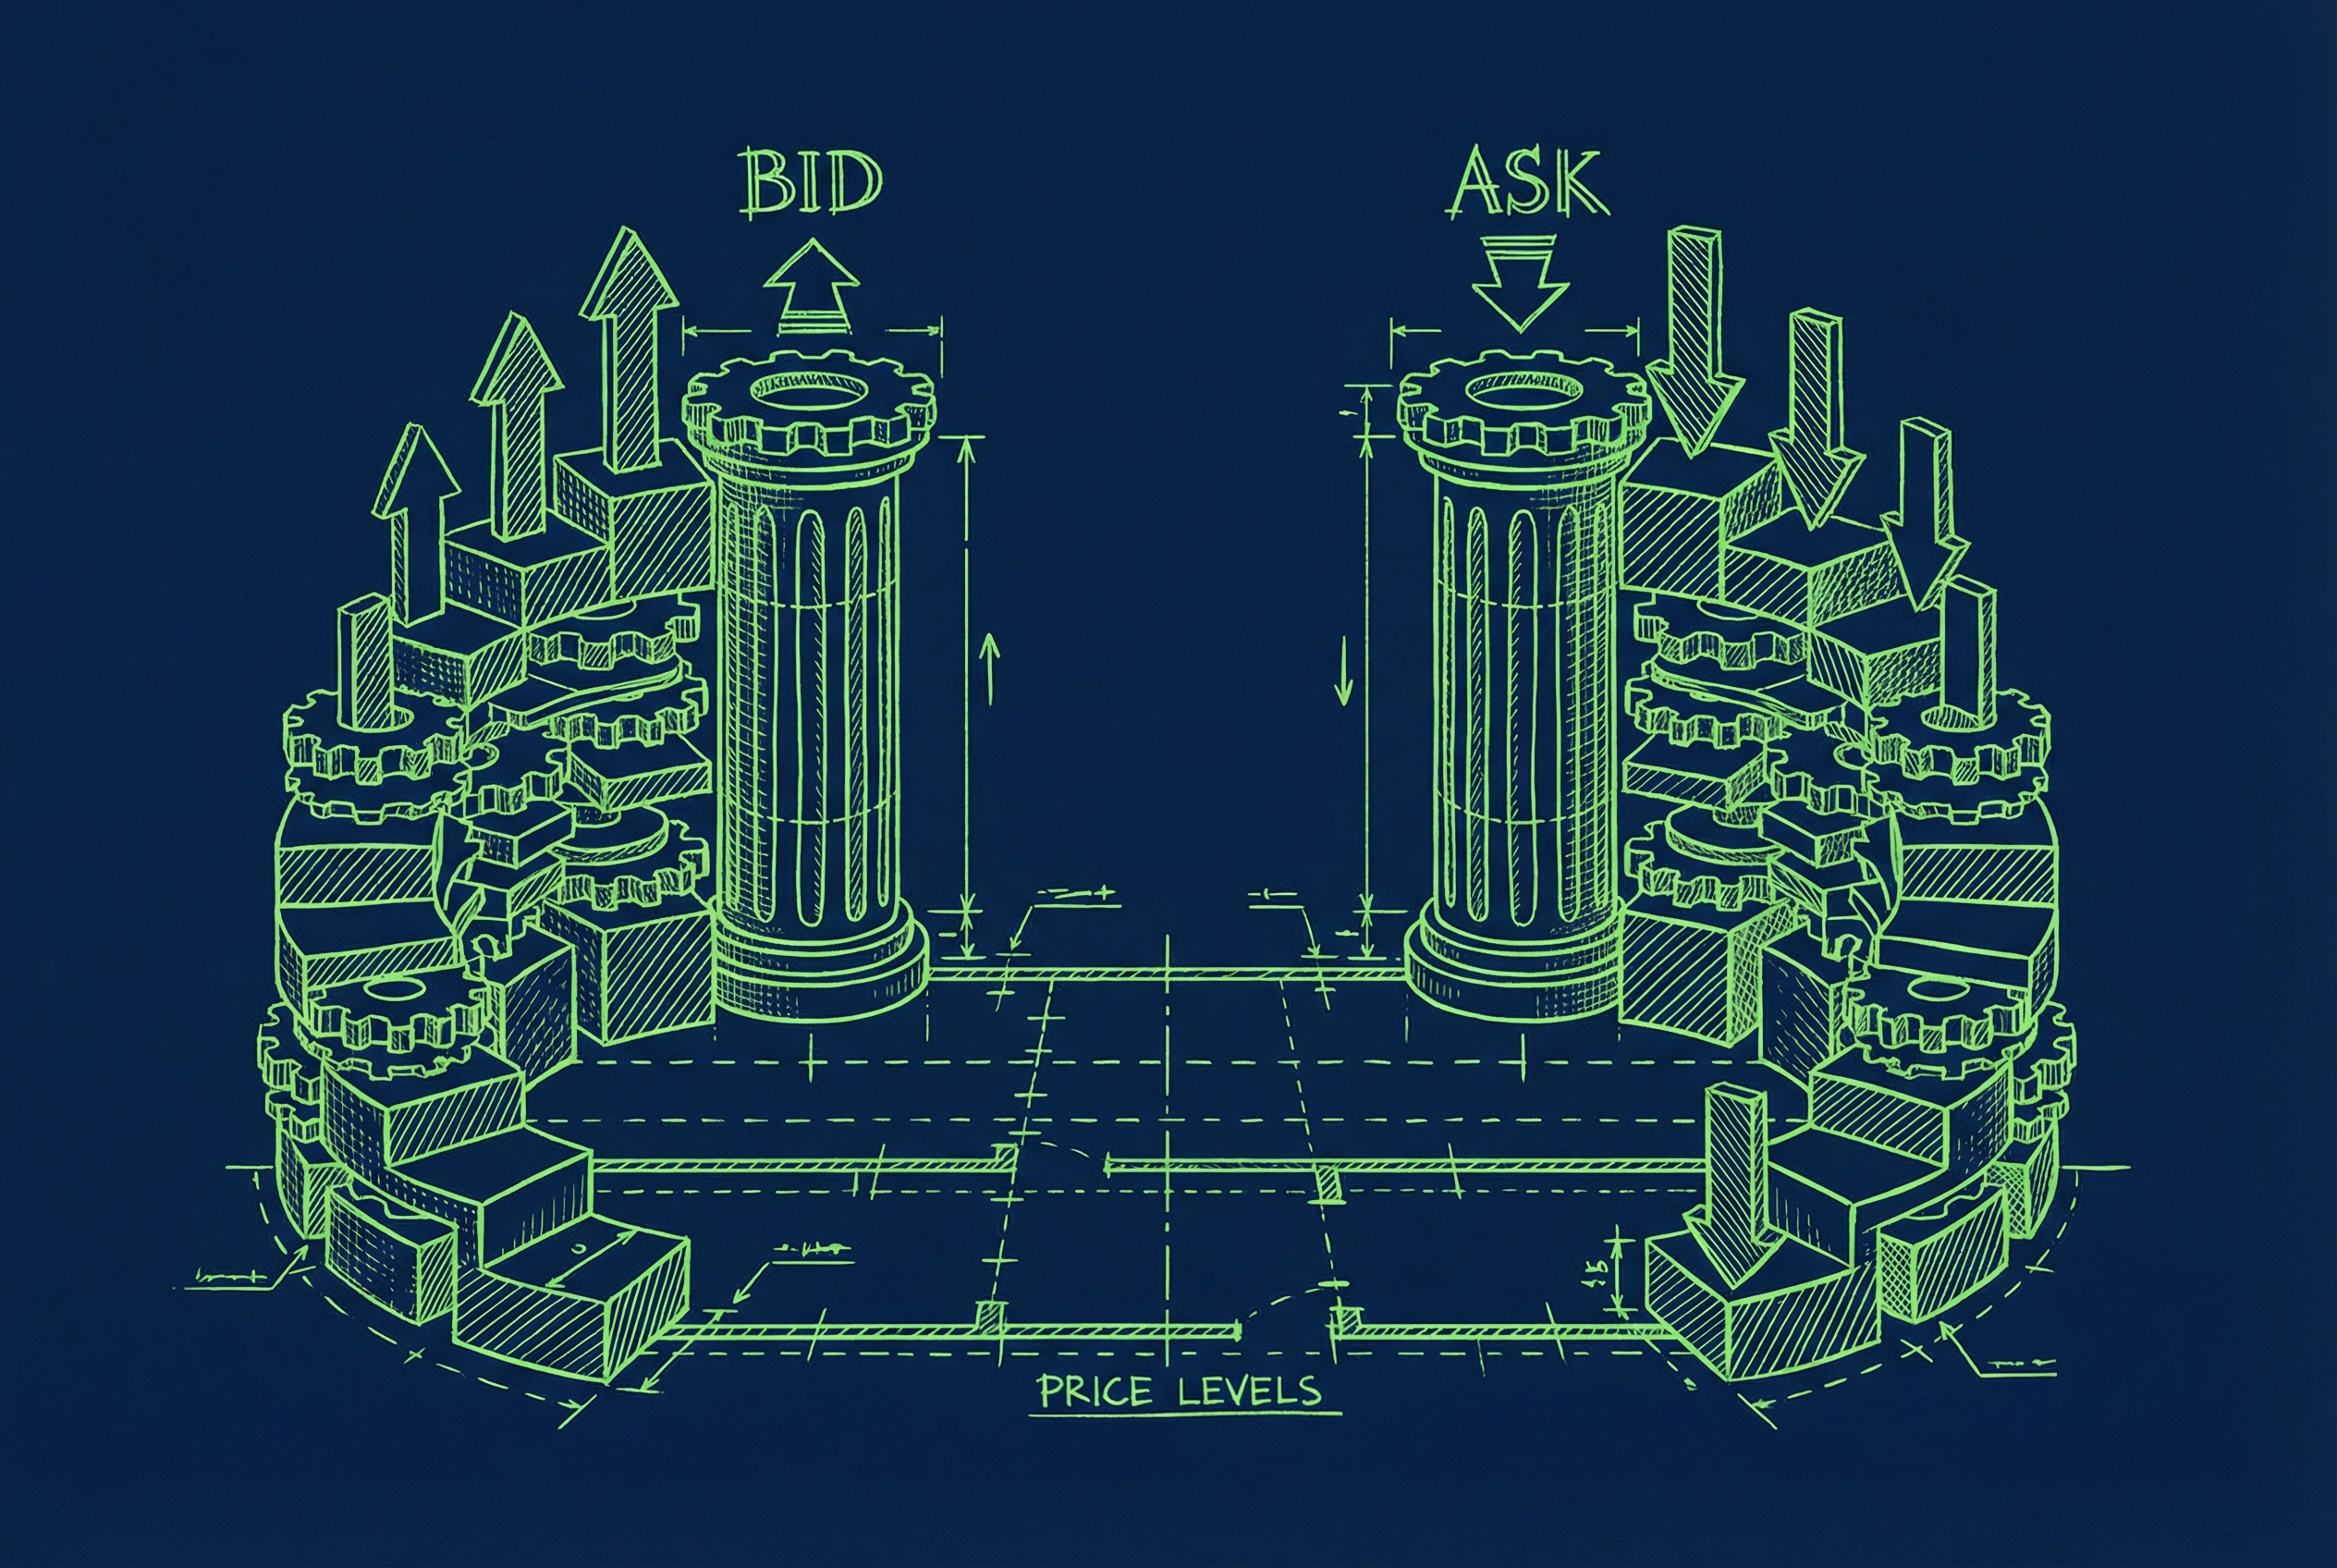
Slippage: The difference between the price when your signal fired and the price you actually executed at. For liquid large-cap stocks, this is typically 1–3 basis points. For illiquid small-caps, it can be 10–50 basis points.
Market impact: The price movement caused by your own order. For large orders, this can be significant. Use TWAP or VWAP execution algorithms to minimize market impact.
Fill rate: The percentage of limit orders that get filled. A strategy that looks profitable with 100% fill rate may be unprofitable with a realistic 60–70% fill rate.
Applied Ideas
The frameworks discussed above translate directly into deployable trading logic. Here are concrete next steps for practitioners:
- ▸Backtest first: Validate any signal-generation or risk-management approach with walk-forward analysis before committing capital.
- ▸Start small: Deploy with fractional position sizing and paper-trade for at least one full market cycle.
- ▸Monitor regime shifts: Set automated alerts for when your model detects a regime change — manual review before large rebalances is prudent.
- ▸Iterate on KPIs: Track Sharpe, Sortino, max drawdown, and win rate weekly. If any metric degrades beyond your predefined threshold, pause and re-evaluate.
- ▸Combine signals: The strongest edges come from combining uncorrelated signals — pair the ideas in this post with your existing alpha sources.
Sources & Research
4 articles that informed this post


From Theory to Practice
The concepts discussed in this article are exactly what we build into our products at QuantArtisan.
Found this useful? Share it with your network.