Backtesting: The Art of Historical Simulation
A backtest is a simulation of how a trading strategy would have performed on historical data. Done correctly, it is the most powerful tool in a quant's arsenal. Done incorrectly — which is far more common — it produces results that are worse than useless because they create false confidence.
The Hierarchy of Backtest Biases
Look-ahead bias is the most common and most damaging. It occurs when your strategy uses information that would not have been available at the time of the trade. Examples: using the closing price to generate a signal and then "buying" at that same closing price; using adjusted prices that incorporate future corporate actions; using fundamental data with point-in-time issues.
Survivorship bias occurs when your universe of assets only includes companies that survived to the present day. If you backtest a strategy on the current S&P 500 constituents using 20 years of data, you've excluded every company that went bankrupt, was acquired, or was delisted during that period — systematically biasing your results upward.
Overfitting is the subtlest and most insidious bias. Every time you look at your backtest results and adjust your strategy parameters, you are fitting to noise. The more parameters your strategy has, and the more times you've adjusted them, the more your backtest results reflect the idiosyncrasies of your historical sample rather than a genuine edge.
The Correct Backtest Workflow
- 1.Formulate hypothesis before looking at data
- 2.Define parameters without optimization
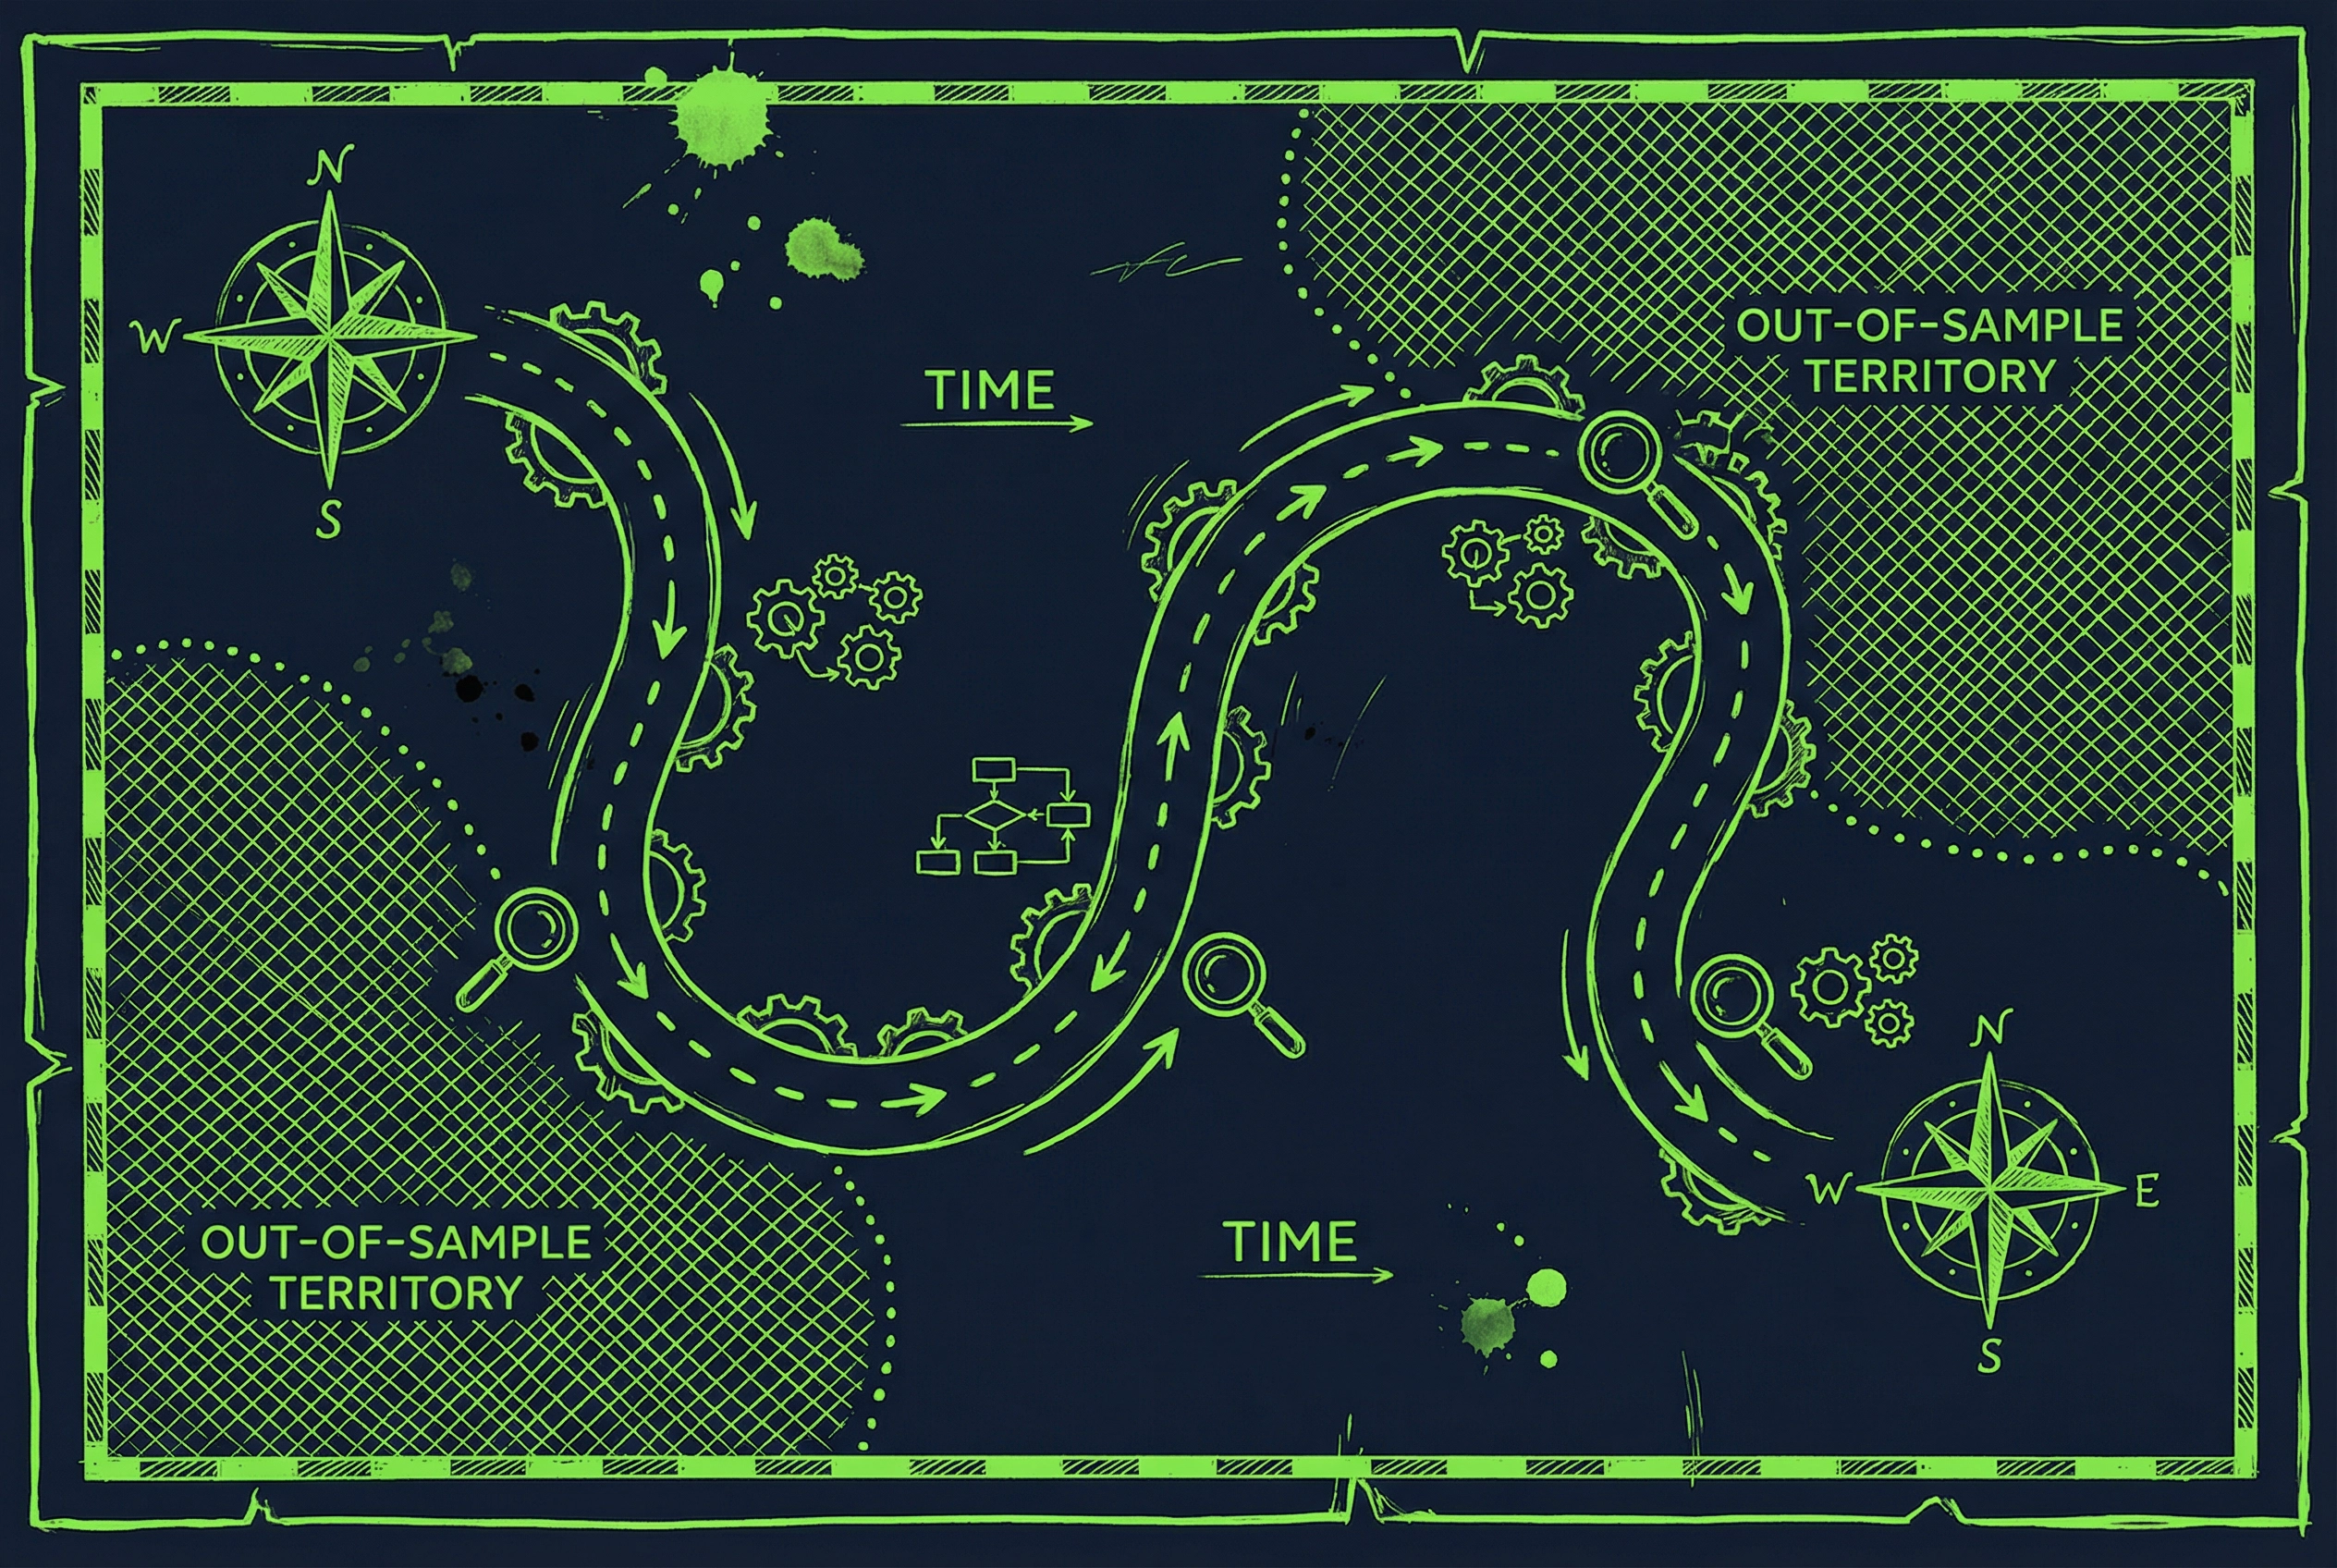
- 3.Run backtest on in-sample period (e.g., 2000–2015)
- 4.Lock the strategy — no further changes
- 5.Validate on out-of-sample period (e.g., 2015–2020)
- 6.Paper trade before committing capital
- 7.Deploy with reduced size and monitor for regime change
The out-of-sample test is sacred. The moment you use it to make strategy adjustments, it becomes in-sample.
Minimum Viable Statistics
For a backtest to be statistically meaningful, you need a minimum number of independent trades. The rule of thumb: at least 100 trades, preferably 300+. With fewer trades, the confidence interval around your Sharpe estimate is so wide as to be meaningless.
Applied Ideas
The frameworks discussed above translate directly into deployable trading logic. Here are concrete next steps for practitioners:
- ▸Backtest first: Validate any signal-generation or risk-management approach with walk-forward analysis before committing capital.
- ▸Start small: Deploy with fractional position sizing and paper-trade for at least one full market cycle.
- ▸Monitor regime shifts: Set automated alerts for when your model detects a regime change — manual review before large rebalances is prudent.
- ▸Iterate on KPIs: Track Sharpe, Sortino, max drawdown, and win rate weekly. If any metric degrades beyond your predefined threshold, pause and re-evaluate.
- ▸Combine signals: The strongest edges come from combining uncorrelated signals — pair the ideas in this post with your existing alpha sources.
Sources & Research
4 articles that informed this post


From Theory to Practice
The concepts discussed in this article are exactly what we build into our products at QuantArtisan.
Found this useful? Share it with your network.